Turning Moment Diagram -Definition
- Turning moment diagram is a graphical representation of turning moment or torque (along Y-axis) versus crank angle (X-axis) for various positions of a crank.
- It is also called a Crack effort Diagram.
- It is plotted on cartesian coordinates, in which the turning moment is taken as the ordinate and crank angle as abscissa.
Significance of Turning Moment Diagram:-
1. It shows variation of Turning moment with respect to the crank angle of an Engine.
2. The variation of Torque indicates the size of Flywheel
3. More variation indicates Larger Flywheel and vice-a-versa.
4. Single curve variation is an indication of single-cylinder engine.
5. More than one curve indicates Multi-cylinder engine.
6. Area below and above of the mean torque line indicated the requirement of power or generation of power during that angle.
The above points can be well understood and explained by the Turning moment diagram and we can design the proper flywheel for the engine for reducing the speed variation of the crank during each cycle.
Uses of Turning Moment Diagram
- The area under the TMD gives the work done per cycle.
- The work done per cycle when divided by the crank angle per cycle gives the mean torque T m.
- The mean torque Tm multiplied by the angular velocity of the crank gives the power consumed by the machine or developed by an engine.
- The area of the TMD above the mean torque line represents the excess energy that may be stored by the flywheel, which helps to design the dimensions & mass of the flywheel.
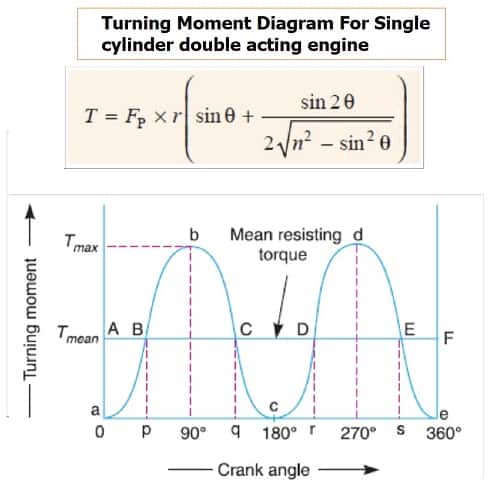
Turning Moment Diagram For Single cylinder double acting engine
A turning moment diagram for a single cylinder double acting steam engine is shown in Fig. The vertical ordinate represents the turning moment and the horizontal ordinate represents the crank angle. The turning moment on the crankshaft,
Where
FP = Piston effort,
r = Radius of crank,
n = Ratio of the connecting rod length and radius of the crank, and
θ = Angle turned by the crank from the inner dead center.
From the above expression, we see that the turning moment (T ) is zero when the crank angle (θ) is zero. It is maximum when the crank angle is 90° and it is again zero when the crank angle is 180°.
This is shown by the curve abc in Fig and it represents the turning moment diagram for outstroke. The curve cde is the turning moment diagram for in stroke and is somewhat similar to the curve abc. Since the work done is the product of the turning moment and the angle turned, therefore the area of the turning moment diagram represents the work done per revolution.
In actual practice, the engine is assumed to work against the mean resisting torque, as shown by a horizontal line AF. The height of the ordinate aA represents the mean height of the turning moment diagram. Since it is assumed that the work done by the turning moment per revolution is equal to the work done against the mean resisting torque, therefore the area of the rectangle aAFe is proportional to the work done against the mean resisting torque.
Turning Moment Diagram for Single Cylinder 4 Stroke I.C. Engine:
We know that in a four-stroke cycle internal combustion engine, there is one working stroke after the crank has turned through two revolutions, i.e. 720° (or 4 π radians).
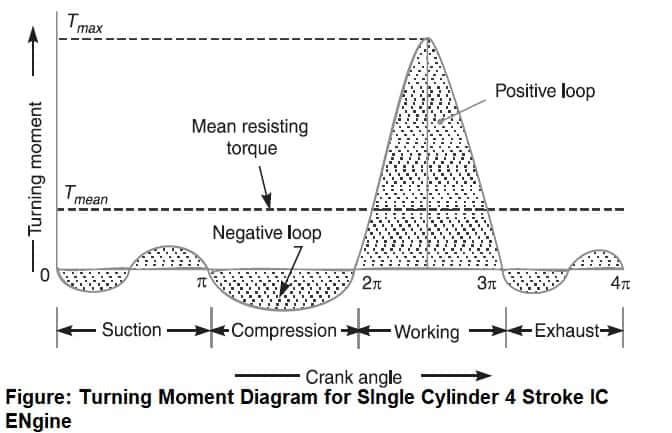
[1] Since the pressure inside the engine cylinder is less than the atmospheric pressure during the suction stroke, therefore a negative loop is formed as shown in Fig.
[2] During the compression stroke, the work is done on the gases; therefore a higher negative loop is obtained.
[3] During the expansion or working stroke, the fuel burns and the gases expand; therefore a large positive loop is obtained. In this stroke, the work is done by the gases.
[4] During the exhaust stroke, the work is done on the gases; therefore a negative loop is formed.
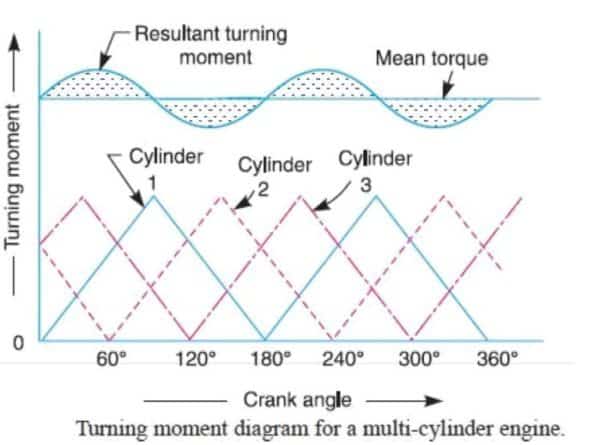
Turning moment diagram for a multi-cylinder engine
A separate turning moment diagram for a compound steam engine having three cylinders and the resultant turning moment diagram is shown in Fig. The resultant turning moment diagram is the sum of the turning moment diagrams for the three cylinders. It may be noted that the first cylinder is the high-pressure cylinder, the second cylinder is the intermediate cylinder and the third cylinder is the low-pressure cylinder. The cranks, in the case of three cylinders, are usually placed at 120° to each other.
Concept of fluctuation energy w.r.t. turning moment diagram
Fluctuation of speed :
The variations of energy above and below the mean speed value are called fluctuations of speed. It is abbreviated as CS
Fluctuation of energy :
The variations of energy above and below the mean resisting torque line are called fluctuations of energy. It is abbreviated as CE.
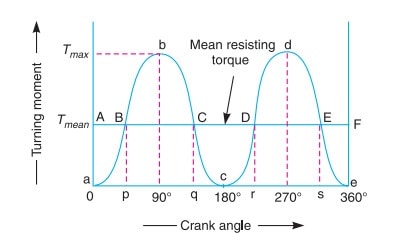
Consider the turning moment diagram for a single cylinder double acting steam engine as shown in Fig. on X-axis crank angle is taken We see that the mean resisting torque line AF cuts the turning moment diagram at points B, C, D, and E. The variations of energy above and below the mean resisting torque line are called fluctuations of energy. The areas BbC, CcD, DdE, etc. represent fluctuations of energy. More fluctuation of energy of energy indicates more variation in the speed and so, the bigger requirement of a flywheel.
Coefficient of fluctuation of energy: It may be defined as the ratio of the maximum fluctuation of energy to the work done per cycle.
Mathematically,
Coefficient of fluctuation of energy,
E = Maximum fluctuation of energy/Work done per cycle
Coefficient of fluctuation of speed: The difference between the maximum and minimum speeds during a cycle is called the maximum fluctuation of speed. The ratio of the maximum fluctuation of speed to the mean speed is called the coefficient of fluctuation of speed.
Maximum fluctuation of energy:
Δ E = Maximum energy – Minimum energy
= (E + a1) – (E + a1 – a2 + a3 – a4) = a2 – a3 + a4
Referecence : https://nptel.ac.in/content/storage2/courses/112101096/download/lecture-8.pdf
More Resources /articles
Theory of Machine Article , Notes , Question and Answer
Manufacturing Technology Notes , Articles
Mechanical Subjectwise Basic Concept Notes ,Articles
Machine Design Notes , article , Interview Que. and Ans.
Source: https://learnmech.com/turning-moment-diagram/
Posted by: frankfrankstandifure0272133.blogspot.com
